Analysis of Multivariate NASA Airfoil Wind Tunnel Data
Data Set 1:
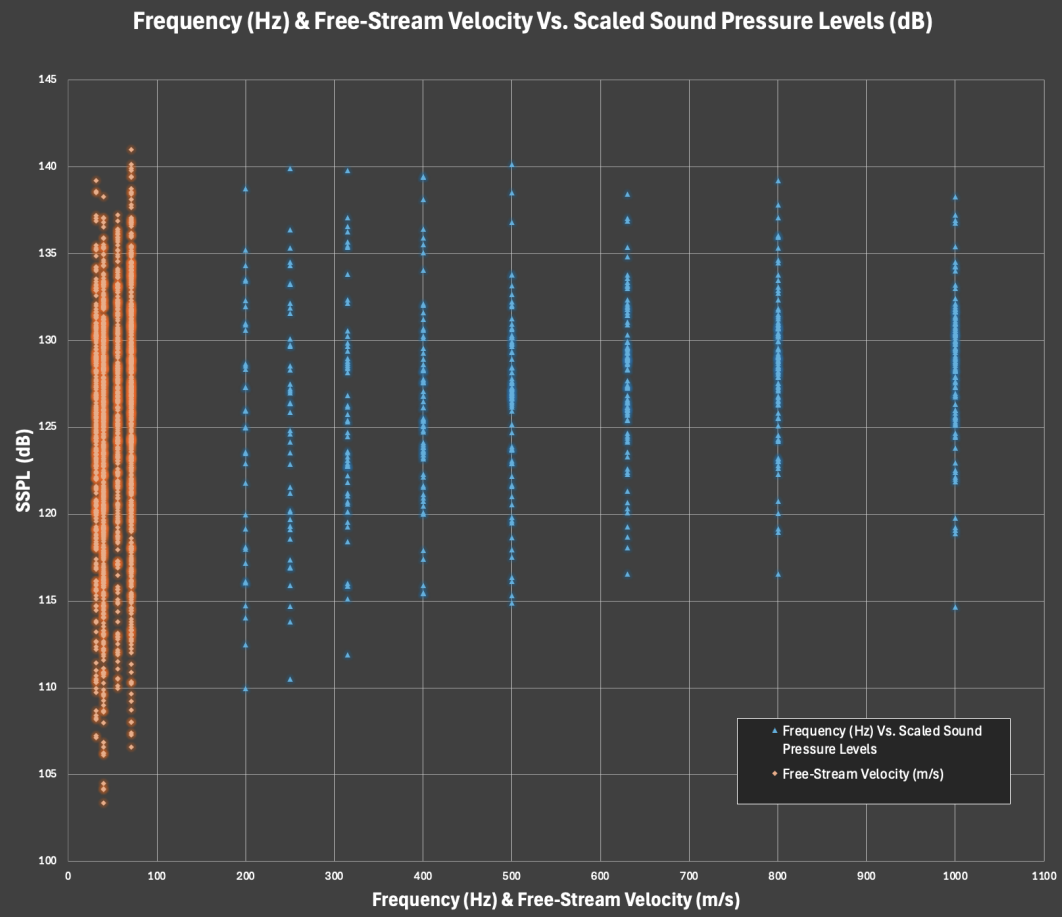
Using a NASA dataset obtained from a series of aerodynamic and acoustic tests of two- and three-dimensional airfoil blade sections conducted in an anechoic wind tunnel, I used Excel to analyze the relationship between frequency (Hz) & free-stream velocity (m/s) and scaled sound pressure levels (dB), where frequency & free-stream velocity are the independent variables and scaled sound pressure level is the dependent variable. The data was taken from a NASA study on Airfoil Self-Noise linked here: https://archive.ics.uci.edu/dataset/291/airfoil%2Bself%2Bnoise
Data Set 2:
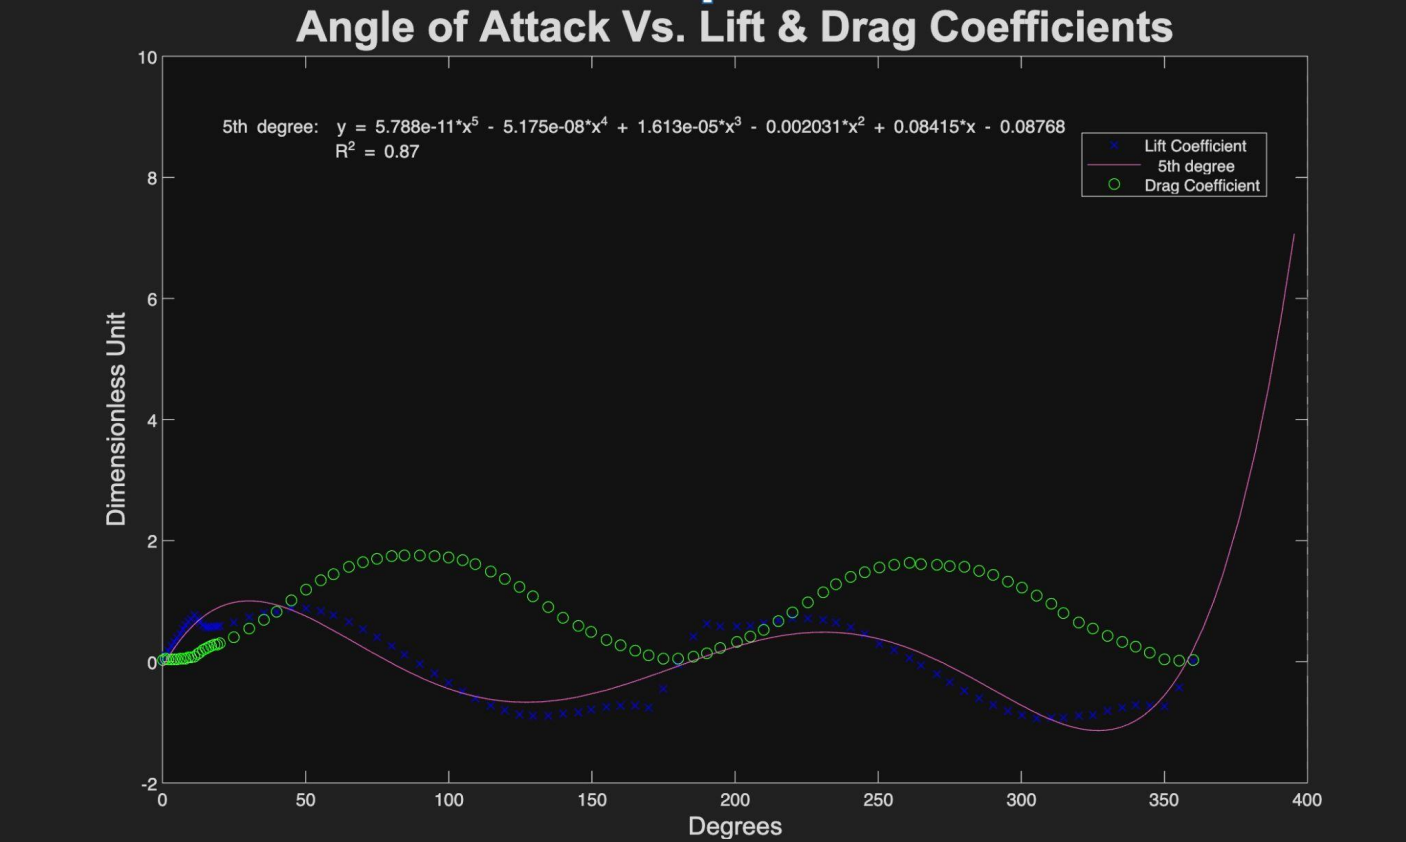
Lift and drag coefficient data through 360 degrees of attack for three airfoils: (1) NACA 0012, (2) NACA 2412, and (3) Selig S1210. Wind tunnel data was captured for each airfoil at two Reynolds Numbers: 50,000 and 100,000. Experimental data that capture full-circle angles of attack are necessary to generate models that can accurately predict the performance of vertical-axis wind turbines. I used MATLAB to analyze the relationship between angle of attack (in degrees) and the lift and drag coefficients (dimensionless units), where angle of attack is the independent variable and the lift/drag coefficients are the dependent variables. The raw data was sourced from an analysis of the NACA 0012 Re=50K Airfoil Model: https://data.mendeley.com/datasets/dz4bv26ncd/1.
